Normal (Gaussian) distribution
z-score · P(X<x) · 68–95–99.7 rule
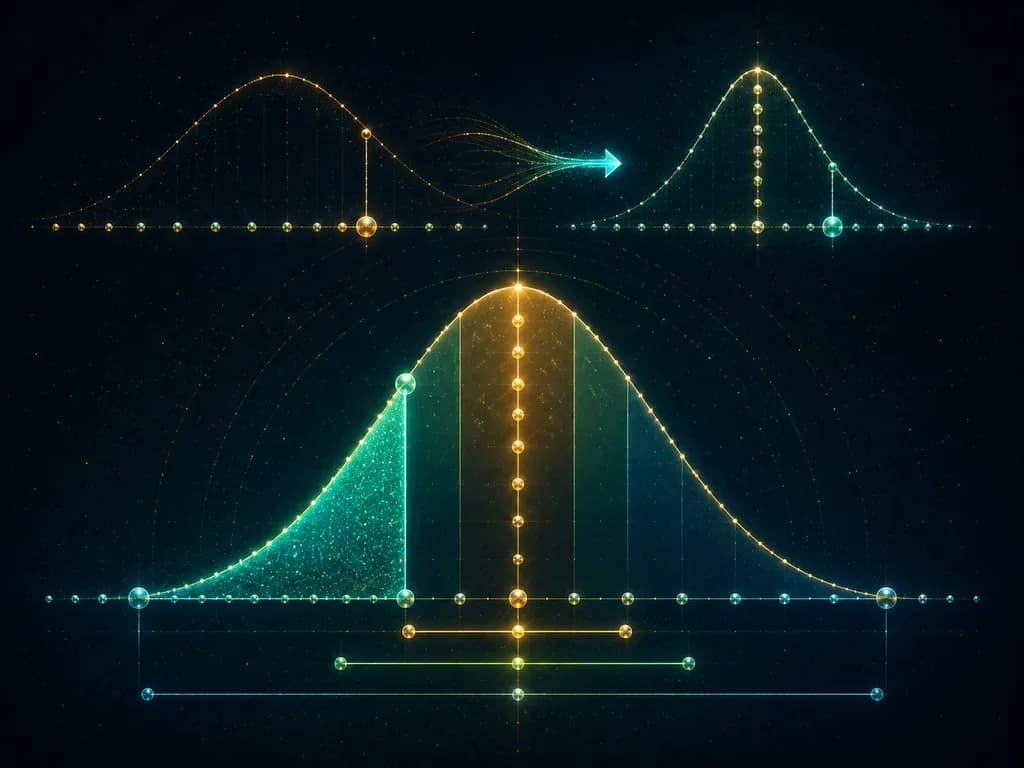
Standardization: z = (x − μ)/σ. The cumulative distribution Φ(z) gives the probability that the variable is less than x. About 68% of values lie within ±σ, 95% within ±2σ, 99.7% within ±3σ.
The normal distribution is the most important distribution in statistics — the “bell curve”. Standardization converts a value into a z-score:
which tells you how many standard deviations lies from the mean. The cumulative distribution gives the probability .
The 68–95–99.7 rule (three-sigma rule) states what fraction of the data falls within intervals around the mean:
Examples
Frequently asked questions
What is the standardized z-score?+
The number of standard deviations between a value and the mean. z = 0 is the mean itself, z = 2 means a value two σ above the mean. It lets you compare data from different distributions.
Where does the 68–95–99.7 rule come from?+
These are the areas under the Gaussian curve over the intervals ±1σ, ±2σ, ±3σ around the mean. Approximately 68%, 95% and 99.7% of all values — hence the “three-sigma rule”.
Teaching? Embed this calculator on your site.
Free widget — paste it on your school site, blog or notes. It links to the full version.