The Catenary Curve
An extension of the topic of functions and their graphs (a contrast with the parabola). A freely hanging chain takes the shape y = a·cosh(x/a) — a catenary, not a parabola (despite the resemblance). An inverted catenary is the optimal arch (Gaudí's buildings, the Gateway Arch). This was shown by Huygens, Leibniz and Johann Bernoulli in 1691.
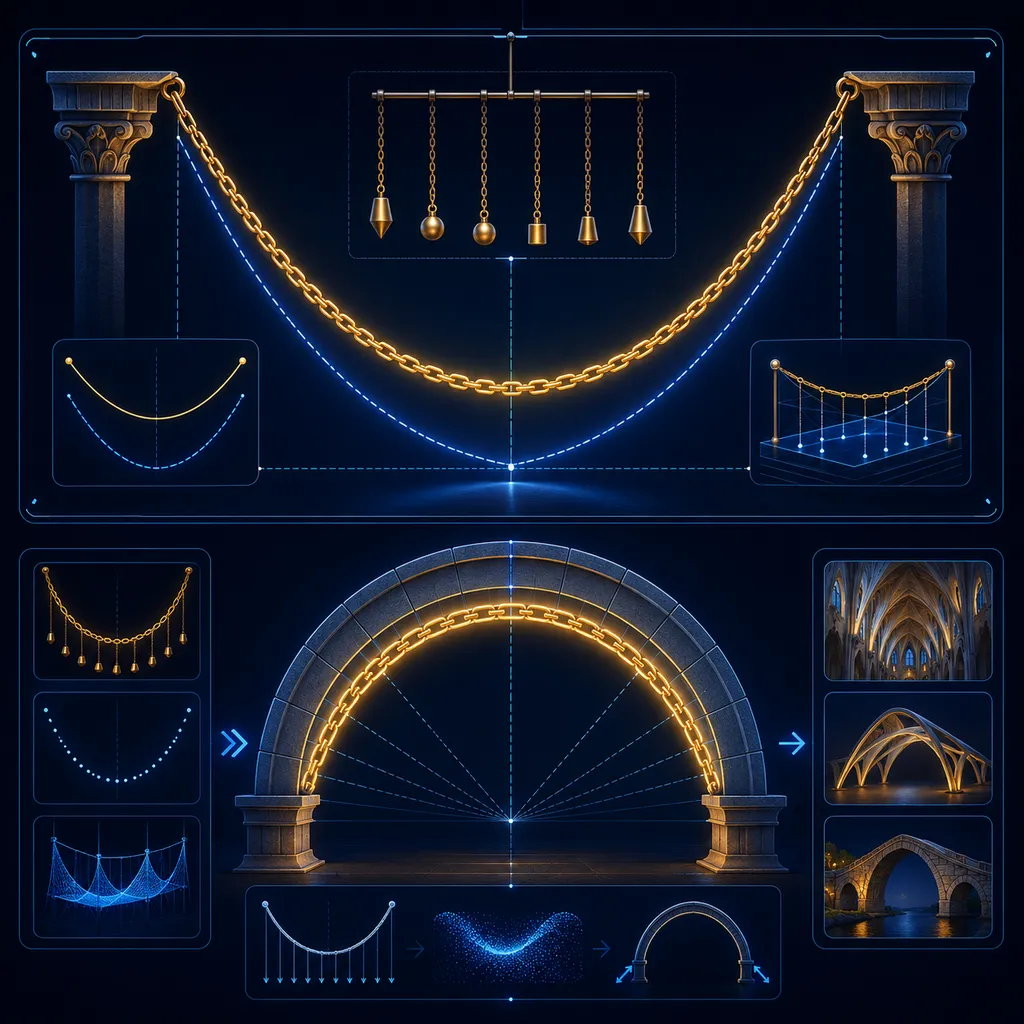
I’ll give you a situation — decide whether the shape is a catenary (cosh) or a parabola. Hint: a rope’s own weight ⇒ cosh; projectile motion or y = x² ⇒ parabola.
What do you see in the scene?
A freely hanging, uniform chain (or rope) suspended from both ends takes the shape of a catenary curve — in Latin catena means “chain”. The superimposed dashed parabola has the same suspension points and the same lowest point, yet the two curves still differ.
The shape of the catenary curve:
where is the hyperbolic cosine, and the parameter depends on the tension and the weight of the chain. The lowest point is at height (because ).
This is NOT a parabola
For a long time it was believed — by Galileo among others — that a hanging chain is a parabola, because the curves look almost identical. Only in 1691 did Huygens, Leibniz and Johann Bernoulli independently show that it is a function, not . The catenary is slightly “fuller” on the sides — this is exactly the difference you see between the yellow and the blue curve.
Inverted catenary = the perfect arch
When we invert the catenary, we get the mathematically optimal shape of an arch: it carries the load purely through compression, with no bending stresses. That is why Antoni Gaudí chose it in his buildings, as did the designers of the Gateway Arch in St. Louis.
Why this matters for your exam:
A beautiful example that a subtle mathematical difference ( instead of ) has real significance in architecture and engineering. It also shows hyperbolic functions in practice and teaches caution: “it looks like a parabola” does not mean “it is a parabola”.
Remember: a freely hanging chain is a catenary curve — not a parabola. Inverted, it gives a perfect arch.
Theory & formulas
The shape of the sag
A freely hanging, uniform chain takes the shape of a catenary curve:
It is not a parabola
A parabola looks similar, but the catenary is described by the hyperbolic cosine — it grows faster toward the sides.
The inverted catenary
Turned “upside down,” it gives the optimal load-bearing arch (Gaudí's buildings, the Gateway Arch), because it carries the load as pure compression.
Notation: the parameter (the larger it is, the shallower the sag), the hyperbolic cosine.
Frequently asked questions
›What shape does a hanging chain form?
A catenary curve described by the function y = a·cosh(x/a) — not a parabola.
›How does a catenary differ from a parabola?
They look alike, but they are different curves — the catenary is a little “fuller” toward the sides.
›Where is the inverted catenary used?
As the optimal arch shape — in Gaudí's buildings and in the Gateway Arch in St. Louis.
Teaching? Embed this experiment on your site.
Free widget — paste it on your school site, blog or notes. It links to the full version.