The four color theorem
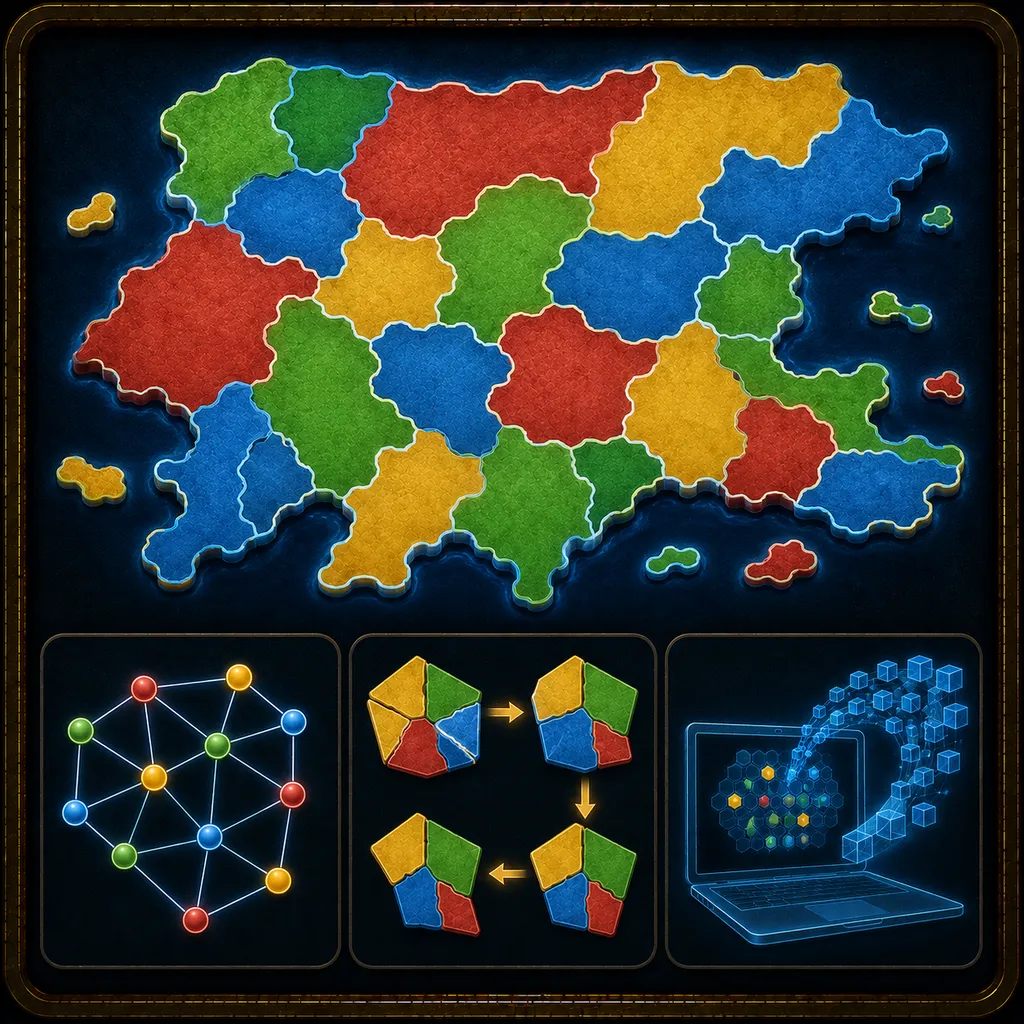
An extension of the graph theory and coloring topic (beyond the syllabus — an aside). Any map divided into regions can be colored so that adjacent regions have different colors using at most 4 colors — no matter how complicated the map is. Kenneth Appel and Wolfgang Haken proved this in 1976, as the first proof in the history of mathematics to make essential use of a computer (checking 1834 map configurations).
I’ll give you a shape — state its chromatic number χ, the smallest number of colors so that neighbors get different colors. The theorem guarantees you never need more than 4.
What just happened?
Three different maps — 4, 6 and 9 regions, with completely different adjacency structures — could all be colored so that no two adjacent regions had the same color, and none of them needed more than 4 colors. This is neither coincidence nor a lucky choice of examples — it is a consequence of a theorem that mathematicians proved for every possible map in the plane.
The model: a map as a graph
We turn each region of the map into a vertex of a graph, and the shared border of two regions into an edge. Coloring the map becomes graph coloring: you have to assign each vertex a color so that no edge joins two vertices of the same color.
where (the chromatic number) is the smallest number of colors needed to color the graph G. A planar graph is one that can be drawn in the plane without crossing edges — exactly the kind that arises from a map divided into regions.
The four color theorem
Any map divided into regions (countries, provinces, plots) can be colored so that no two regions sharing a segment of border (not just a touching point) have the same color — using at most 4 colors. Sometimes 2 or 3 suffice (as in the medium map above — its graph is bipartite), but you never need more than 4, no matter how many regions the map has or how convoluted they are.
Why it was so hard
The problem was posed in 1852 by Francis Guthrie, who was coloring a map of the counties of England and noticed that 4 colors always sufficed. For over 120 years mathematicians tried to prove it or find a counterexample — without success. Only in 1976 did Kenneth Appel and Wolfgang Haken present the first correct proof, groundbreaking not only in its result but in its method: they reduced the problem to checking 1834 “unavoidable” configurations of maps, whose presence rules out the existence of a counterexample. Checking all the cases by hand was impossible — it took the computer over a month of computation. It was the first major mathematical proof in history carried out with essential help from a computer, which stirred controversy: some mathematicians questioned whether a proof that no human can trace step by step by hand can be regarded as a mathematical proof at all.
What does it mean in practice?
Graph coloring reaches far beyond maps: assigning radio frequencies (neighboring transmitters must not interfere), building class timetables (the same people/rooms cannot overlap in time) or register allocation in compilers — everywhere you have to assign resources so that “adjacent” elements do not conflict, it is exactly the same problem.
Why this matters for your exams:
The four color theorem itself is not on the exam syllabus — it is an aside beyond the curriculum. But the passage “map → graph → coloring” is a textbook example of modeling a geometric problem as a graph-theory problem, and reasoning about invariants (here: the number of colors used, which never exceeds 4) is useful in advanced-level combinatorics problems.
Remember: every map in the plane can be colored so that adjacent regions have different colors using at most 4 colors — this is a theorem, proved in 1976 with essential help from a computer after 1834 checked configurations, not merely an observation from individual examples.
Theory & formulas
Statement
Every map in the plane (connected regions) can be colored with at most colors so that adjacent regions (sharing a border segment) have different colors.
The language of graphs
Regions become vertices, adjacency becomes edges. The theorem says that every planar graph has chromatic number .
Computer-assisted proof
Appel and Haken (1976) reduced the problem to checking a finite number of configurations and verified them by computer — the first such proof in the history of mathematics.
Notation: the chromatic number (the smallest number of colors needed).
Frequently asked questions
›How many colors always suffice to color any map?
Four — no matter how complicated the map is.
›Why was Appel and Haken's proof controversial?
Because it required a computer to check 1834 map configurations — impossible for a human to verify by hand.
›How can a map be represented as a graph?
Regions become vertices, and adjacency between regions becomes edges; the task is graph coloring.
Teaching? Embed this experiment on your site.
Free widget — paste it on your school site, blog or notes. It links to the full version.