Hertzsprung–Russell diagram — stellar evolution
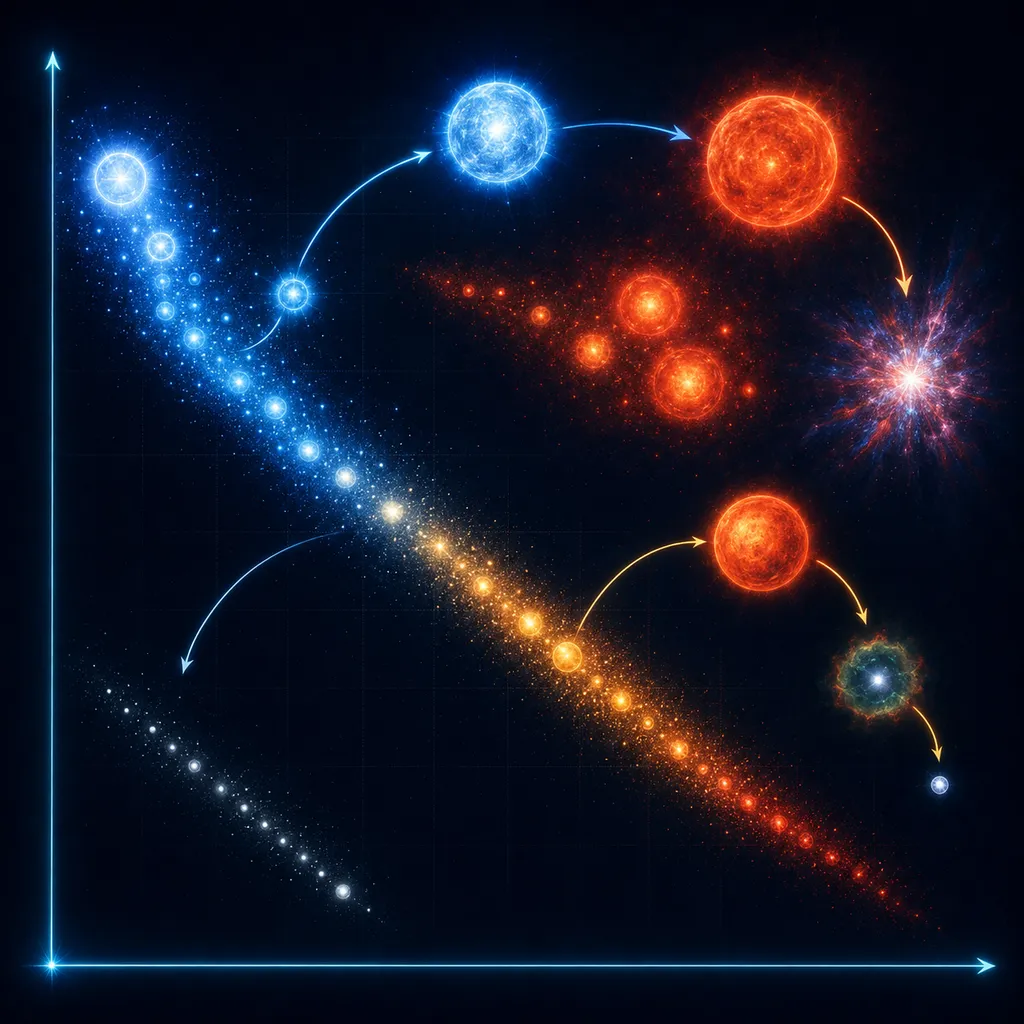
The Hertzsprung–Russell diagram orders stars by temperature (horizontal axis) and luminosity (vertical axis). Most stars lie on the main sequence — a single line on which more massive stars are hotter and brighter, but live shorter lives (they burn fuel faster). The final fate depends on mass: low-mass → white dwarf, massive → supernova. Change the star's mass.
What does the H-R diagram show?
Each dot is one star: the horizontal axis is its temperature (decreasing to the right — hot blue stars on the left), the vertical axis its luminosity on a logarithmic scale. It is not a map of the sky, but a map of kinds of stars.
Main sequence — a single line:
Most stars (including the Sun) lie on a single band — the main sequence — where hydrogen fuses into helium in the core. Change the mass: the star moves along the same line. A heavier star is both hotter and brighter (top-left corner), a lighter one — cooler and fainter (bottom-right).
Luminosity, temperature and mass:
Luminosity rises very steeply with mass — a star twice as heavy shines about 11 times brighter. That is why massive stars are so bright and hot.
Evolution stages and fate from mass:
When the hydrogen runs out, the star leaves the main sequence and swells into a giant (cool but very bright — top-right corner). The end depends on mass: < 8 M☉ → it sheds its envelope and becomes a white dwarf; ≥ 8 M☉ → it explodes as a supernova, leaving behind a neutron star or a black hole.
Why do massive stars live short lives?
A heavier star has more fuel (∝ M), but burns it incomparably faster (∝ L = M^3.5). The balance works against it: the Sun will last about 10 billion years, while a 30 M☉ star — only a few million.
Why this matters for your exam:
The H-R diagram is a classic of exam astrophysics. Be able to point out the main sequence, giants and white dwarfs, link a position to temperature and luminosity, and justify that the greater the mass, the shorter the life — the argument via .
Remember: on the main sequence more mass = hotter, brighter and shorter. A star’s fate is decided by its mass: a white dwarf, or a supernova and whatever it leaves behind.
Theory & formulas
Main sequence
The H-R diagram plots temperature (horizontal axis) against luminosity (vertical axis). Most stars lie on the main sequence — they fuse hydrogen into helium.
Mass governs everything
For main-sequence stars, luminosity rises very steeply with mass: More massive stars are therefore hotter and brighter.
Lifetime
The amount of fuel is , and it is consumed at a power , so: That is why massive stars live short lives. Final fate: low mass → white dwarf, mass → supernova.
Notation: — luminosity (power), — stellar mass, — temperature, — solar mass.
Frequently asked questions
›What does the H-R diagram show?
The relationship between the temperature (colour) and the luminosity of stars. It lets you classify stars and trace the stages of their evolution.
›What determines a star's fate?
Mainly on mass: low-mass stars end as white dwarfs, while massive ones (≥8 solar masses) explode as supernovae, leaving behind a neutron star or a black hole.
›Why do massive stars live short lives?
Because they shine far brighter (L∝M^3.5) and burn their fuel much faster than low-mass stars — despite their larger reserves.
Teaching? Embed this experiment on your site.
Free widget — paste it on your school site, blog or notes. It links to the full version.